Turning Fragmented Data Into a Clear Real-Time Dashboard
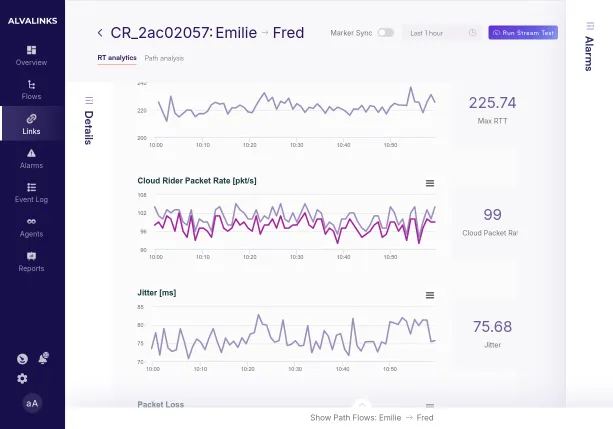
Data is great — but what do you do when it arrives from so many different sources, in formats that don't talk to each other?
In a recent project with the successful startup Alvalinks, we faced a genuine technical challenge. Alvalinks provide a real-time video monitoring solution. The deep technology that analyzes and correlates the underlying data is theirs — it's the core of what they do. What they asked us to build was a polished dashboard that connects their complex technology stack to what their customers actually need to see: information arriving as a heavy time-series stream, XML configuration files, and classic SQL databases, all unified into one clear screen showing what's happening right now.
We could have set off on a long, cumbersome development journey. Instead, we chose a different path.
Value first: an MVP
The goal was to give the customer monitoring and performance visibility as fast as possible — not to wait for a "perfect" product, but to ship something that works and delivers immediate value.
Communication before code
The real breakthrough didn't happen only at the keyboard — it happened in conversation. We kept a tight, daily feedback loop with the Alvalinks team to sharpen the challenge, understand exactly which metrics were critical to them (like latency and bitrate), and build a solution that fit like a glove.
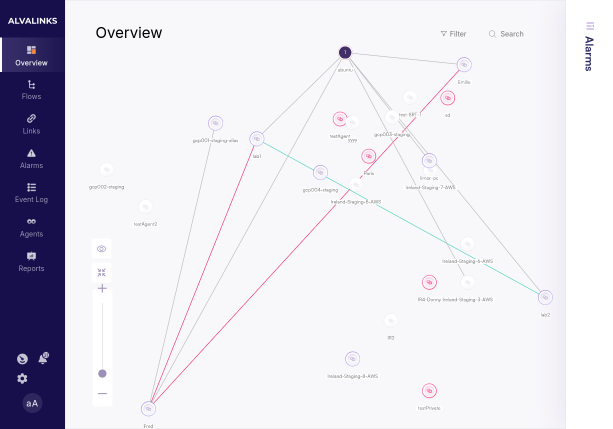
The result is a sleek, intuitive dashboard that turns raw, fragmented data into a clear picture
their customers can act on.
Proud to be the technology partner of companies racing forward. If you need help presenting complex data clearly, reach out.